Crossovers are an essential part of designing any audio system. From the passive designs used with a bookshelf or floor-standing speaker to three- and four-way electronic designs employed in car audio systems, ensuring signals combine correctly is crucial for delivering great sound. Crossovers can have different frequencies, slopes, and alignments. Understanding how audio signals from two speakers combine after being filtered is essential for creating exceptional audio systems. Let’s analyze the output of different crossover point alignments and slopes.
What is a Crossover?
In the simplest terms, a crossover is a circuit that allows your installer to divide audio frequencies into different parts. We’ll discuss two types of crossovers today—high-pass and low-pass. A high-pass filter allows audio signals above the crossover point to pass through, while a low-pass filter permits audio information that’s lower in frequency to go through.
In a simple two-way speaker design, like those found in a component set or small bookshelf speakers, the designer will include a high-pass filter for the tweeter and a low-pass filter for the midrange driver.
The primary purpose of the high-pass filter in this application is to limit the amount of midrange and low-frequency energy going to the tweeter. Tweeters have almost no cone or diaphragm excursion capability. That doesn’t mean they don’t move back and forth; they do. However, they only move by a tiny fraction of an inch. For example, if you send audio information below 300 hertz to a tweeter, it will physically bottom out and likely be destroyed.
Small Speaker Protection
Secondly, and more specifically for tweeters, audio information contains more energy at lower frequencies. A tweeter might have a 75 to 100-watt power rating; however, this rating would be determined with something like a 5 kHz filter in place. As such, the driver will likely only ever see a small fraction of the total power.
The image below shows the spectral response of pink noise. We often use pink noise in audio system configuration and calibration as it represents how we hear music. To put it another way, this sloped red line sounds like there is an equal amount of energy in the bass, midbass, midrange, and high-frequency regions.
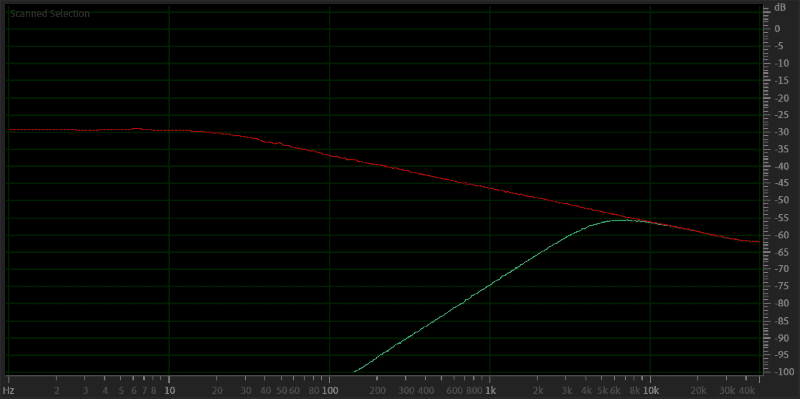
A graph of pink noise in red and the signal to a tweeter after a 5 kHz 12 dB/octave filter has been applied in green.
The green line is the same pink noise track, but we’ve applied a 5 kHz 12 dB/octave high-pass filter to the signal. You can see that the peak energy level around 6.5 kHz is at -57 dB. The peak of the unfiltered pink noise is at -30 dB. If the pink noise were at 100 watts, then the tweeter would only see 0.2 watts. This is the process used to rate the power handling of tweeters. Yes, a 100-watt tweeter likely can’t handle more than 0.5 to 1 watt of power.
Crossover Characteristics – Frequency
The number one criterion in setting a crossover is selecting a crossover frequency. This frequency is where the output of the crossover is at the same level, whether configured as a high-pass or low-pass filter. For some types of crossovers, this point might be at -3 dB from the unfiltered level, while others might be at -6 dB.
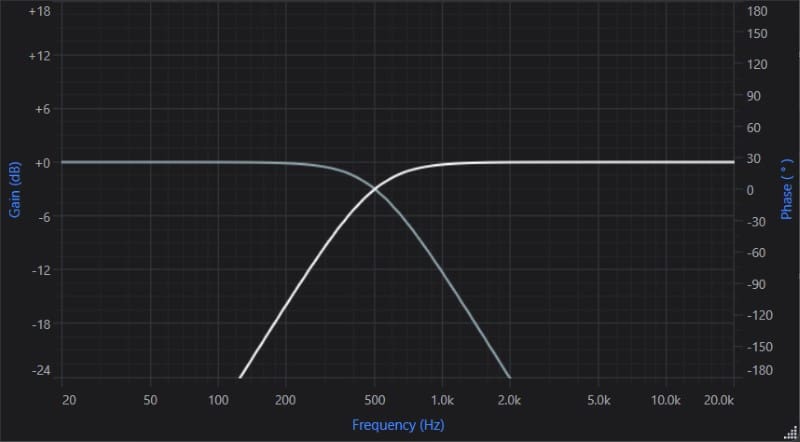
High-pass (white) and low-pass (gray) crossovers set to 500 Hz.
The image above shows the predicted frequency responses of two crossovers. The white trace is a high-pass crossover set to 500 Hz, while the gray line is a low-pass crossover set to 500 Hz. As you can see, the crossovers intersect at precisely 500 Hz. Furthermore, the amplitude, or output level, is at -3 dB at this frequency.
Crossover Characteristics – Slope
As you can see in the image above, some audio on the other side of the crossover passes through the filter. The rate at which the signal is attenuated is called the slope. We describe slopes in decibels per octave. In the example above, for every octave we move away from the crossover point, the output is 12 dB lower. This is called a -12 dB/octave crossover.
For most car audio applications, especially when considering the crossovers in a radio, amplifier, or digital signal processor, we usually use -12 dB/octave or -24 dB/octave. There are other options, though. A -6 dB/octave filter mimics the response of adding a capacitor or inductor in series with a speaker. Slopes in source units and digital signal processors rarely exceed -48 dB/octave. That said, -24 dB/octave provides a good balance of speaker protection without too much effect on phase. We’ll explain the phase shortly.
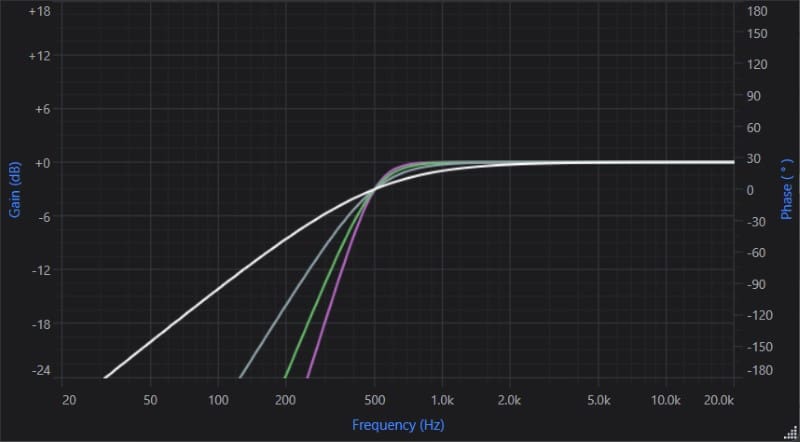
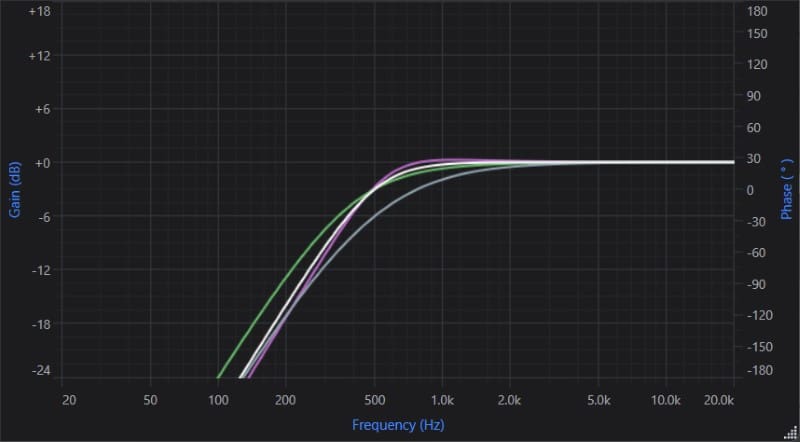
Examples of -6 dB (white), -12 dB (gray), -18 dB (green), and -24 dB/octave (violet) 500 Hz high-pass filter slopes.
Crossover Characteristics – Alignments
The math or physical characteristics of how a crossover works can vary dramatically from one implementation to another. You might have heard of Butterworth, Linkwitz-Riley, Bessel, and Chebyshev crossover alignments. These names describe the attenuation rate, frequency response, phase response, and behavior at the crossover point.
A comparison of -12 dB/octave Butterworth (white), Linkwitz-Riley (gray), Bessel (green), and Chebyshev (violet) crossover alignments.
Each type of filter has its benefits and drawbacks. To be clear, a filter’s frequency response describes how two signals sum around the crossover point. This is the crux of this article. We use crossovers to filter and protect smaller speakers but not reduce audio quality.
We could write an article on each of the different crossover alignments. For our discussion in this article, we will focus on Butterworth and Linkwitz-Riley, which are commonly found in digital signal processors and many car audio amplifiers.
Don’t Get Phased
Before we look at how different crossovers sum back together, we need to talk about phase. Phase is the change in time of an AC waveform relative to a reference. You can’t have phase without being able to compare it to something. So, two waveforms might be in phase if each cycle starts and stops at the same point in time. Two waveforms would be described as out of phase if one was moving upwards when the other was moving downward. Here are a few simulated waveforms on our MegaScope to help you visualize this concept.
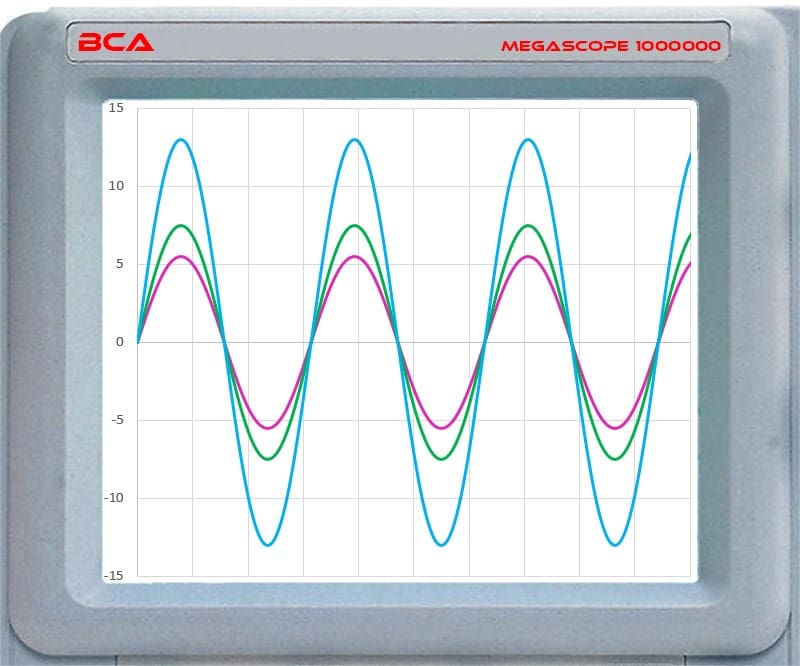
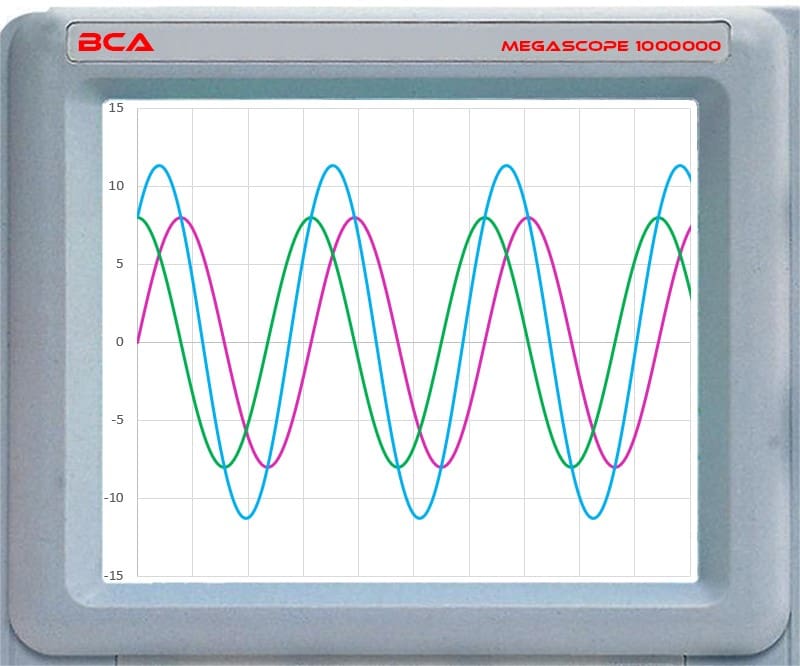
The violet and green audio waveforms cross the 0-line at the same point. They are in phase.
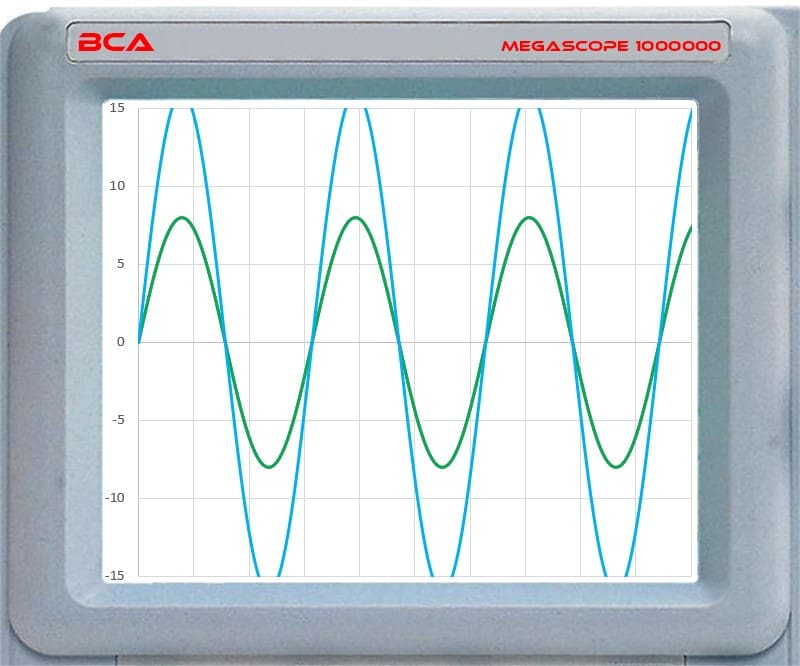
In the above example, the violet and green waveforms have different amplitudes but cross the 0-line at the same point. This indicates they are in phase and have the same frequency. The blue line represents the sum of the waveforms.
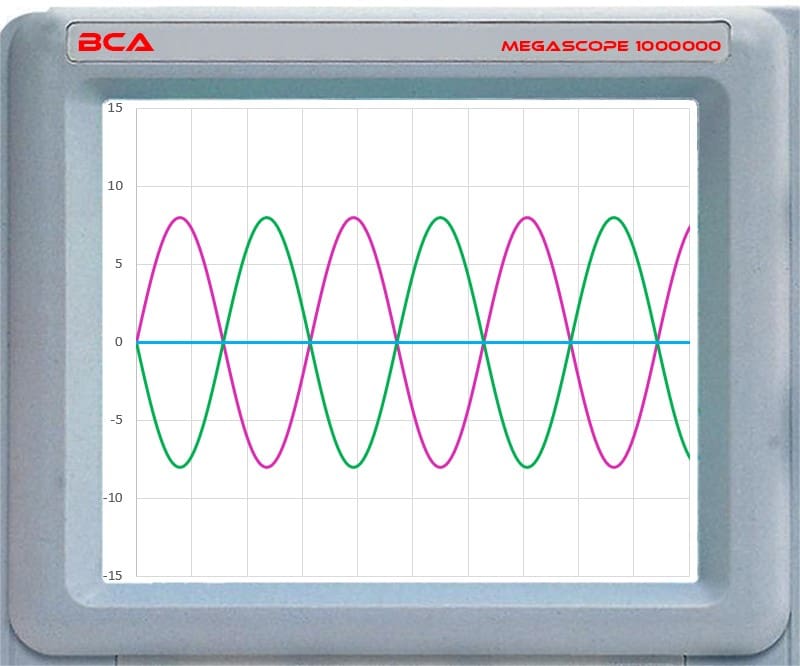
The violet and green waveforms cross the 0-line at the same point but travel in opposite directions. These waveforms would be described as having reversed polarity.
In this second example, two waveforms start at the same point in time and cross the 0-line at the same point. This means the waveforms have the same frequency. However, when one waveform moves upward, the other moves down. We describe this as having reversed polarity. This is NOT the same as being “out of phase.” When we add the amplitudes, we get 0, as shown by the blue line.

Two waveforms that start at different points in time.
This graph shows that the violet waveform starts a 1/4-cycle after the green. These waveforms are described as being out of phase. They have the same frequency and amplitude, but they don’t cross the 0-line at the same time. The critical consideration here is the starting time.
Phase is a complex topic that can be difficult to grasp. Improper terminology adds to the confusion.
One last tidbit of complexity before we move on: We describe the point in a waveform using degrees. One complete cycle is 360 degrees. This would be where the waveform crosses the 0-line, moving upwards to where that repeats. If a waveform starts half a cycle late, we describe it as being 180 degrees out of phase. Understanding that this delayed start is NOT the same as having opposite or reversed polarity is crucial.
Phase and Crossover Alignments – First Order
Now that we have a foundational understanding of the factors that define crossovers and some knowledge of phase, we can discuss phase specifically related to crossover slopes. All crossovers can be described using the term order. A first-order crossover has a slope of -6 dB/octave. At the crossover frequency, the signal phase will have shifted by 90 degrees.
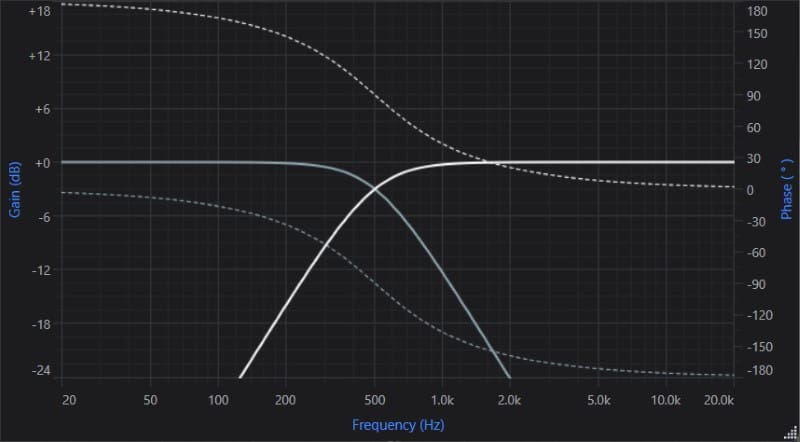
First-order high-pass filter amplitude (white) and phase (dotted white) response. First-order low-pass filter amplitude (gray) and phase (dotted gray) response.
The image above shows a 45-degree phase shift at the 500 Hz crossover point for a first-order high-pass filter. This means the start and stop points of a 500 Hz waveform are delayed by 1/8 of a cycle. A low-pass filter has a -45-degree phase shift, meaning the waveform would be 1/8 of a cycle ahead or earlier than if there were no filter. This 90-degree difference in phase between the two signals makes it very difficult to add the output of two first-order filters back together.
Waveforms with a 90-degree phase shift as seen on an oscilloscope.
Phase and Crossover Alignments – Second Order
If we looked at two 16-volt peak-to-peak 500 Hz waveforms on an oscilloscope, we’d see they sum to only 22.6, not 32 volts. This would present a dip in the frequency response at the crossover point.
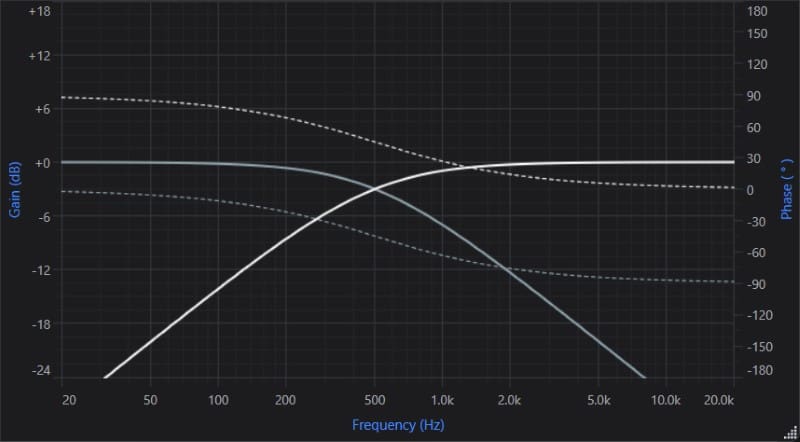
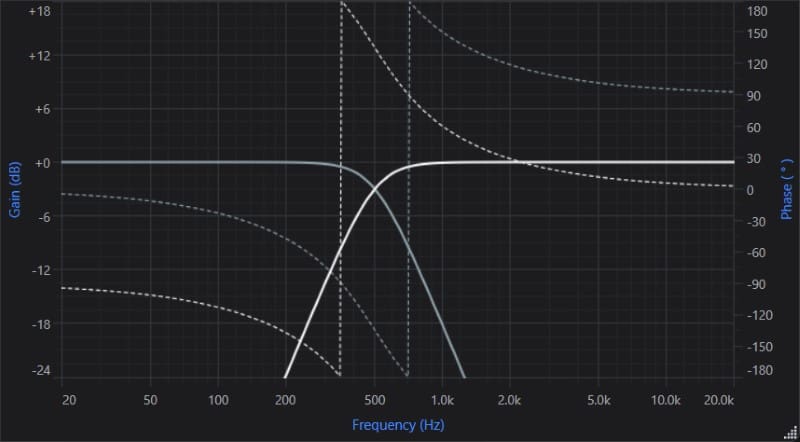
Second-order high-pass filter amplitude (white) and phase (dotted white) response. Second-order low-pass filter amplitude (gray) and phase (dotted gray) response.
We now have second-order filters with the crossover slopes increased to -12 dB/octave. The 500 Hz crossover point phase is now 90 degrees for the high-pass and -90 degrees for the low-pass filter. If we sum the output of these filters together, the waveforms will cancel each other out because their phase relationships are 180 degrees apart.

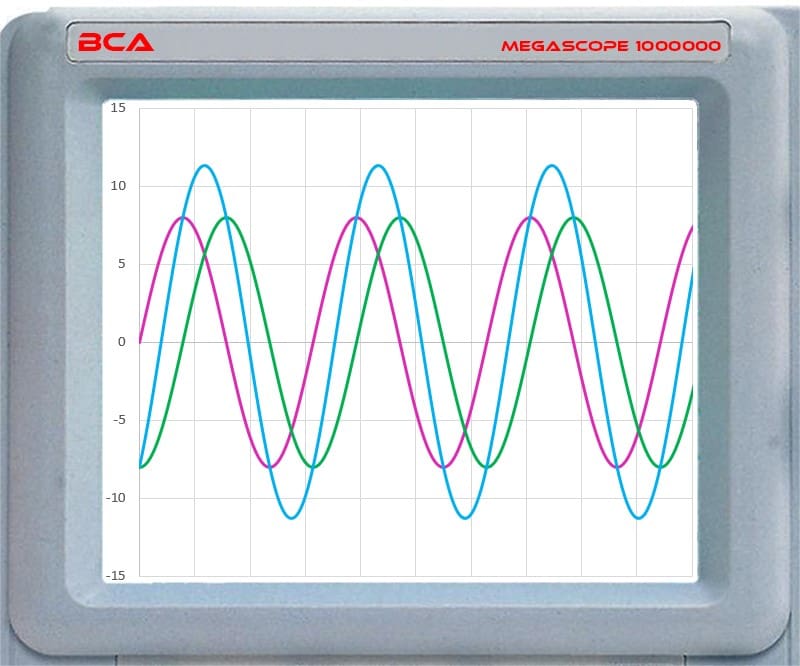
Waveforms with a 180-degree phase shift as seen on an oscilloscope.
Phase and Crossover Alignments – Third Order
Third-order high-pass filter amplitude (white) and phase (dotted white) response. Third-order low-pass filter amplitude (gray) and phase (dotted gray) response.
Our third-order filters shift 135 degrees for the high-pass and -135 degrees for the low-pass. Once again, summing with third-order filters is difficult due to the 270-degree phase mismatch at the crossover frequency.
Third-order high-pass filter amplitude (white) and phase (dotted white) response. Third-order low-pass filter amplitude (gray) and phase (dotted gray) response.
With a fourth-order filter, the high-pass filter has a 180-degree phase shift at the crossover frequency of 500 Hz, while the low-pass filter has a phase shift of -180 degrees at the same frequency. The difference is 360 degrees, which results in perfect summing at the crossover point.
Third-order high-pass filter amplitude (white) and phase (dotted white) response. Third-order low-pass filter amplitude (gray) and phase (dotted gray) response.
Signal Summing and Voltage
If you’re considering how signals sum and how crossovers affect phase response, those second-order filters should raise a red flag. We created several pink noise tracks in Adobe Audition and then applied high-pass and low-pass filters to them. Finally, we combined them back into a single track. The image below shows the resulting frequency response.
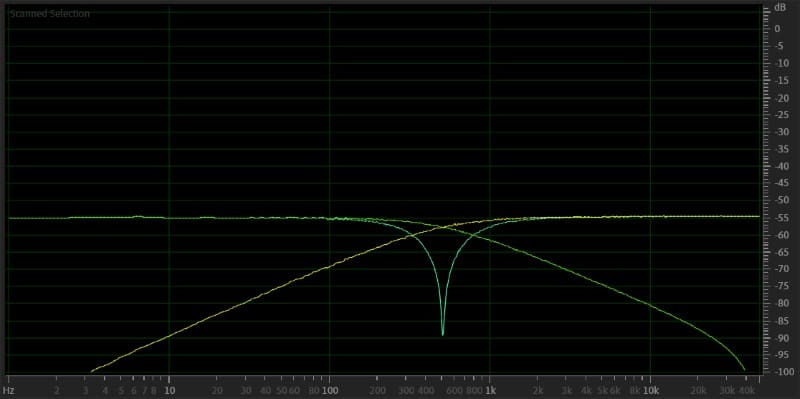
Pink noise filtered with a second-order low-pass filter – yellow. Pink noise with a second-order high-pass filter – green. Filtered signals summed back together – teal.
As predicted, we have a massive notch at the crossover point. There’s an easy fix for this, though. All we have to do is invert the polarity of one of the signals. Here are the same summing process results but with the high-pass filter signal inverted.
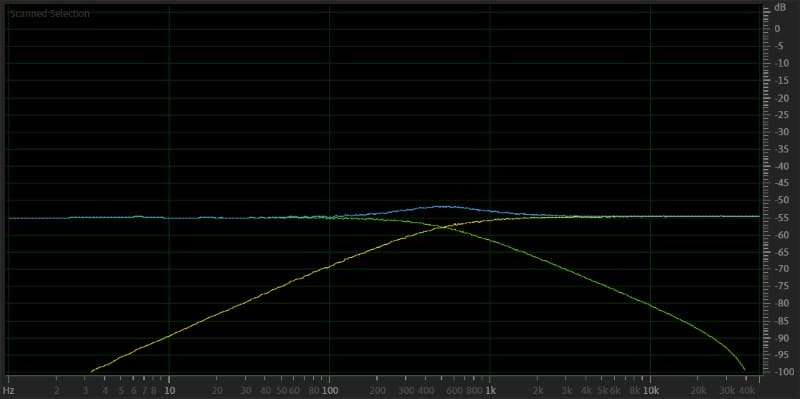
Pink noise filtered with a second-order low-pass filter – yellow. Pink noise with a second-order high-pass filter – green. Filtered signals summed back together – blue.
We don’t have a dip, but we have a 3 dB bump in output around the crossover point. Why is this? As mentioned, second-order Butterworth filters are down -3 dB at the crossover point. If two speakers are playing the same information at the same frequency, that increases output by 6 dB. Thus, -3 dB plus -3 dB is +3 dB. We need the output to be lower at the crossover point.
There may be a theoretical way to underlap the crossover to get the signal to sum flat, but that’s not a recommended or reliable configuration for an audio system and will likely result in unwanted phase issues.
Linkwitz-Riley Crossovers to the Rescue
It might not be a huge surprise, given that we’ve already shown the characteristics of the commonly available crossover alignments. However, Linkwitz-Riley crossovers are at -6 dB at their crossover point, sometimes called the knee frequency. Let’s rerun our simulation in Adobe Audition to see if the math checks out.
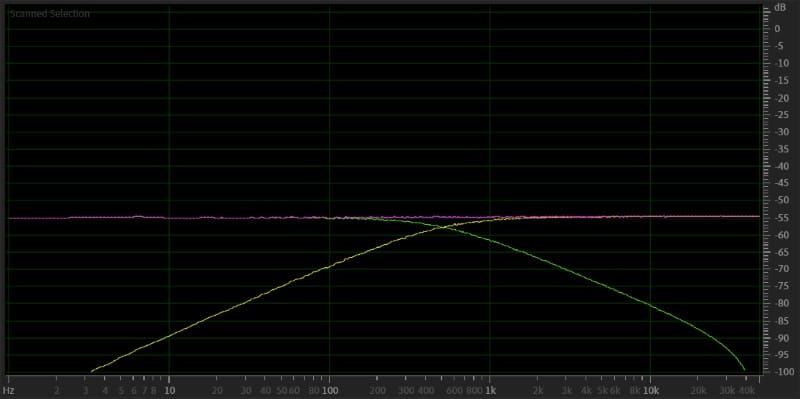
Pink noise filtered with a second-order low-pass filter – red. Pink noise with a second-order high-pass filter – orange. Filtered signals summed back together – violet.
As you can see, the signals are summed together to produce a smooth, flat response. However, we still had to invert the signal polarity of one of the waveforms, as the slopes remained at -12 dB.
Understanding Electronic Crossovers
As you can see, crossovers are much more complicated than most enthusiasts think. Using a calibrated real-time audio analyzer to ensure the frequency response around the crossover point of all the speakers in your vehicle is crucial for ensuring your system sounds its best. You might have a null at the crossover point with a subwoofer or a midbass to midrange driver. Equally unsatisfactory would be a bump in frequency response at a crossover point. Visit a local specialty mobile enhancement retailer today to start the process of improving the performance of your car audio system.
This article is written and produced by the team at www.BestCarAudio.com. Reproduction or use of any kind is prohibited without the express written permission of 1sixty8 media.
